Delta Visualization System
Overview
RebelAntDVS uses tick level trade data to identify and highlight zones where price action results in a relative advantage to buyers or sellers over a selected period. These zones become magnets for price - either to neutralize the previously advantaged side or to probe and utilize the area as a source of liquidity. In more complicated terms, RebelAntDVS is a timeframe independent delta & volume aggregation and visualization system.
Developed by a Trader, for Traders - designed from the outset to enable fast repeatable visual analysis of complex market micro-structure. Provides everything needed to cope with low timeframe trading, though higher timeframe Weekly / Monthly / Yearly profiles are equally accessible.
Fully dynamic data loading enables viewing of as much historical tick data as you have available.
As you look through the features below, you may note we don't make any reference to 'Buy Signals / Sell Signals / other Magic Beans'... There is a reason for this - everything we do is designed to highlight the most important areas and bars within your zone using a variety of adaptive learning systems - if it stands out visually, it's worth paying attention to. There is no way we are going to stick on a BUY! or SELL! arrow anywhere - all this will do is cloud your own thought process and intuition. If any such signal was consistently tradeable, do you think anyone would actually sell it!?
What does a profile show ?
Features
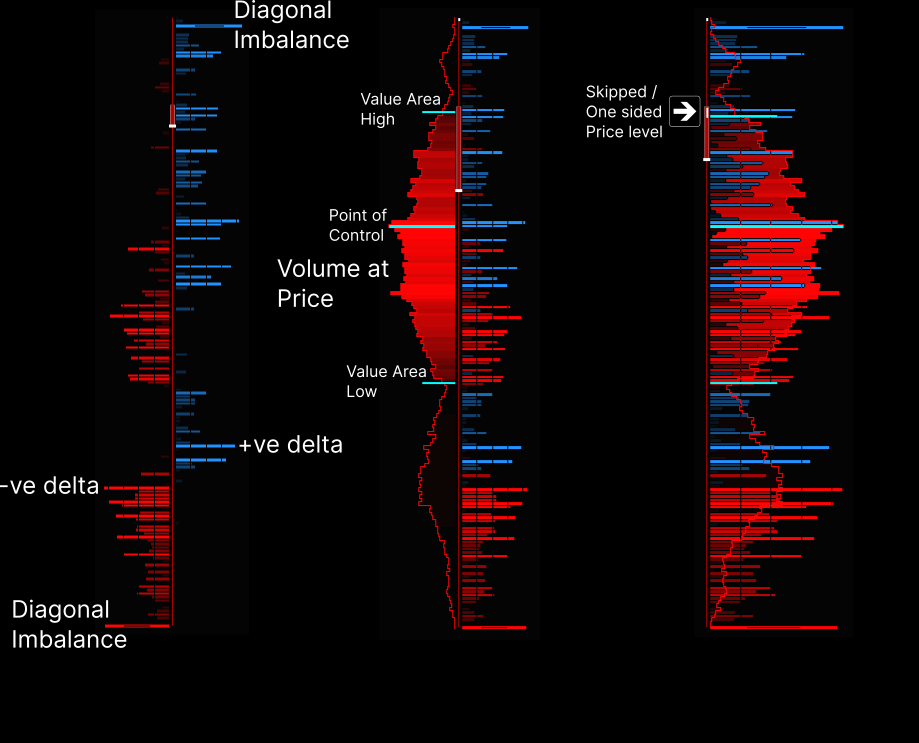
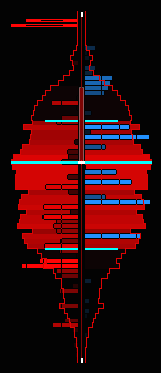
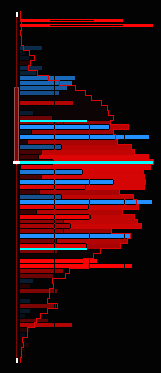
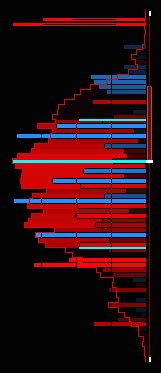
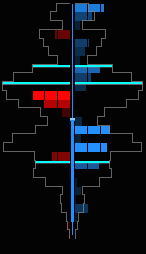
- Delta Profile inc DeltaBlocks which enable you to visually understand how many contracts are in the delta
- Bar and Zone Volume Profiles, PoC, VA
- Automated self tuning Stacks enables identification of horizontal areas of liquidity / delta velocity. Useful for potential entries and targets
- View both Mini and Micro contract profiles side by side on the same chart!
- On Demand data loading - no need to use Tick Replay or have the burden of charts loaded with tick data
- Pause and resume realtime profile building so volume and delta continue to be captured on the bar where paused
- Highly configurable visual styles with graceful enhancement / degradation and ability to view numeric values if required
- Anchored VWAP and Std Deviations
- Visual markers for both horizontal delta and diagonal delta
- Fib reference level paths
- User defined Zones plus dynamic auto zones and presets
- Custom Layout system enables creation of complex workspaces
- Slice / Cluster tick aggregation with configurable mappings - perfect for contracts like NQ
- Bar and Zone Divergence indication
- Futures / Stocks / Fx / Crypto
- Fast Access Menu
- MoveGlyphs
- Summary Row
- No need for Tick Replay
- Compatible with Playback Connection
- Realtime Step Forward and Back analysis
- Customizable relative scaling for width and color
- Multiple visualization styles for Delta & Volume
- Multiple color options including transparent mode, even works with white backgrounds!
- Optional Fast Mode for higher timeframe bars such as weekly / monthly / yearly
- Too many other features to mention!!!
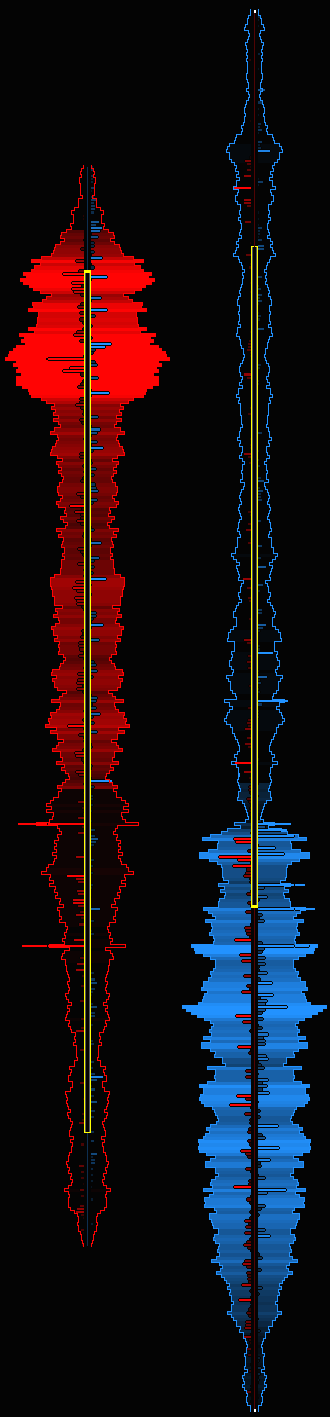
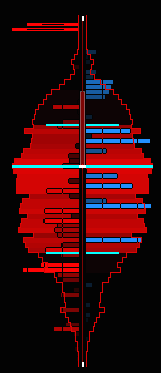
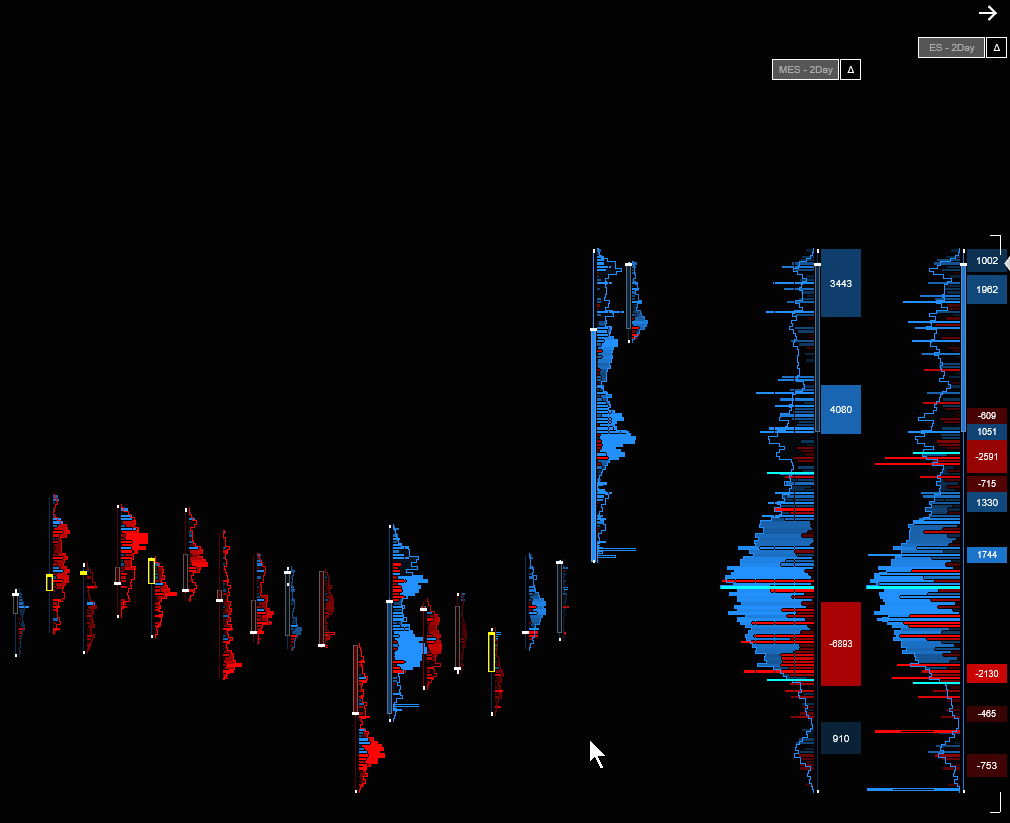
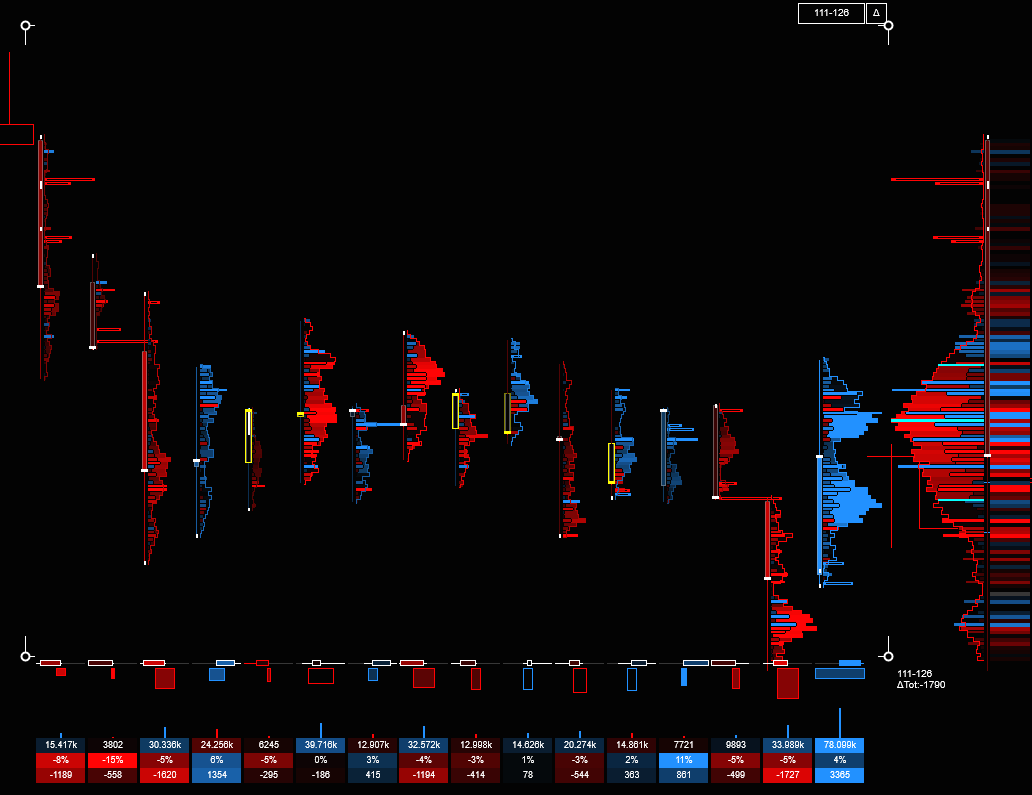
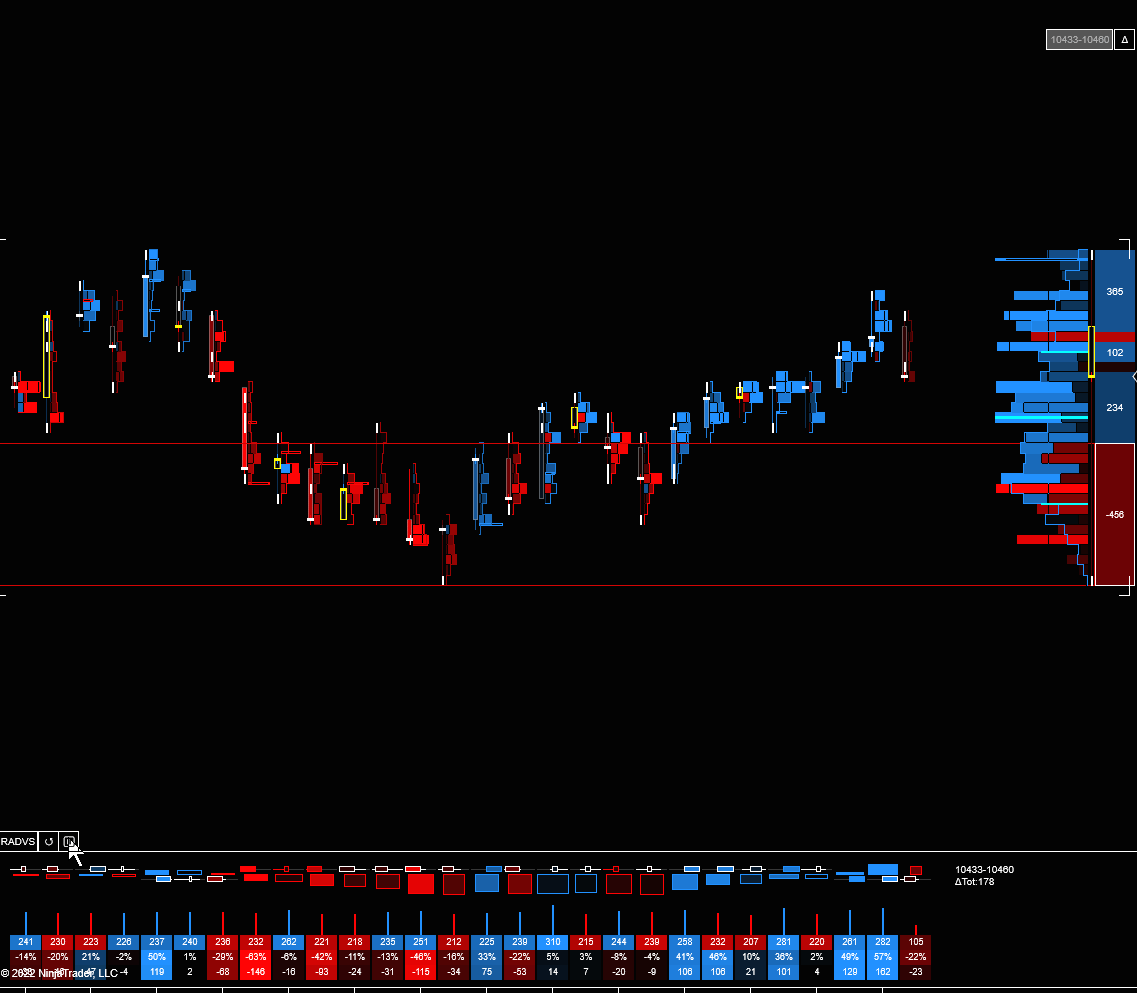
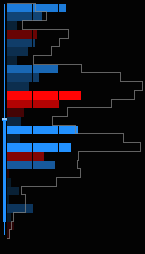
Zone Profile
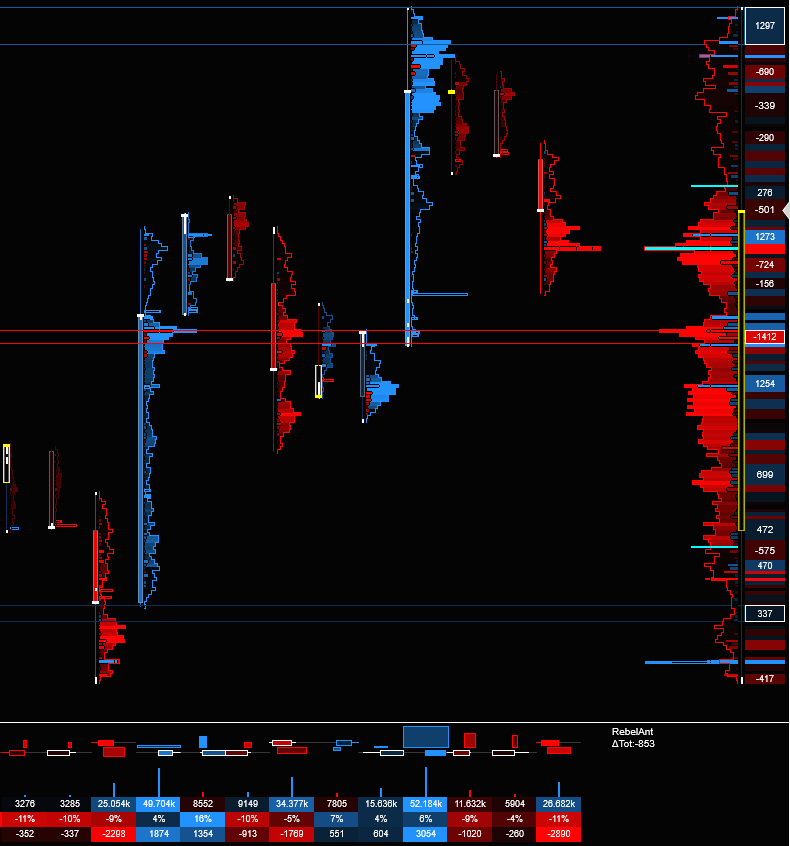
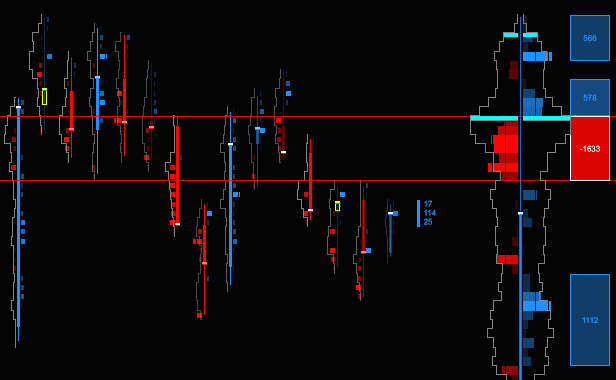
The Zone Profile offers an aggregated view of the Delta and Volume contained within the user defined or automated zone selected. Preset zones are available to capture bars within the current trading Session (ETH, RTH and user defined times are supported), 2 day, 3 day, n-day, n-bars, n-tick / n-volume, as well as a variety of rolling zones which capture a number of bars back from the latest bar or screen edge. By combining a number of different zone configurations on screen at the same time, it's possible to see the bigger picture as well as highly sensitive lower timeframes. Each Zone Profile display can be left floating or locked to the left or right of the screen and positioned to view multiple separate zones onscreen at one time.
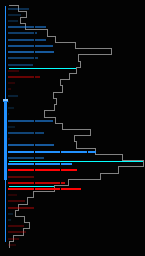
Stacks Column
This column will highlight areas of auto-tuned and user configurable Delta Concentration / Density / Velocity. Highly concentrated areas will project rectangular regions across the screen which are likely to cause a reaction when price next reaches the area. It's often useful to show this column alone on Zones which go further back in time as it may be less important to view the exact point of Delta concentration on such historical areas.
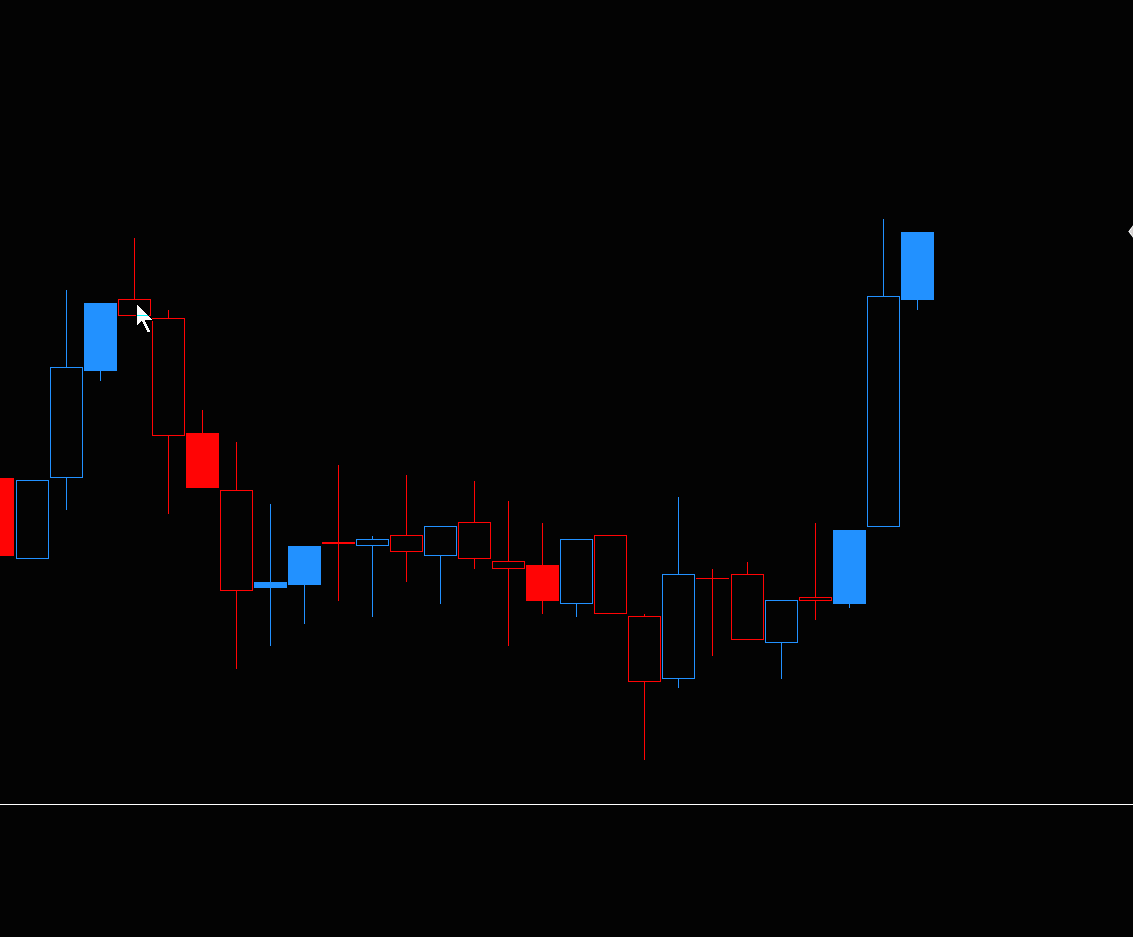
Bar Profiles
Volume and Delta profiles can be configured for bars within any zone. As with the Zone Profile, a variety of visual styles are available. Ordinary bars can be automatically hidden when a bar is contained within a zone or left visible in the background. A key design premise of the system has been to ensure ordinary bars are immediately available to the user when required.
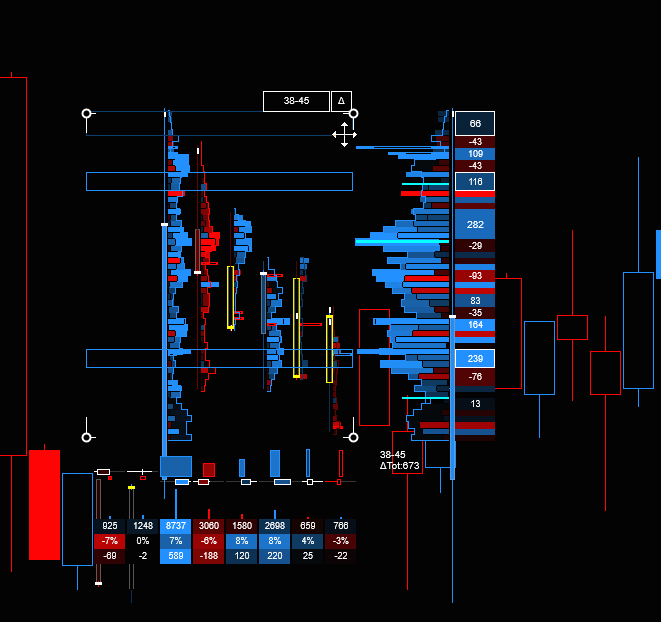
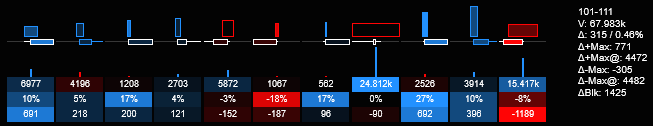
Summary Row
These rows of data can be locked to the top or bottom of the screen, placed in one or more separate panels, or left floating. You can choose to display separate rows with Volume, Volume Histogram, Delta% and Delta and / or a single combined bar which condenses a large amount of information into a quickly consumable visual display. A small horizontal bar records the progress of each bars Delta OHLC. The Volume of each bar is shown as the width of the histogram and the opacity represents increasing Delta% which is user definable. Finally the height of the histogram represents the Anchored Cumulative Delta.
Side by Side Mini-Micro Contracts
The ability to watch multiple contracts side by side on the same screen offers a novel way to spot opportunities which others can't see. Designed for seamless switching between instruments, with multiple options to ensure you keep the right contract in the right profile when changing which contract you're actually trading.
Graceful Enhancement & Degradation
While a lot of work has been put in to ensure important areas are visually highlighted (or dimmed) so that you don't have to interpret a wall of numbers, they are there if you want them!
Comprehensive color options and transparency
The visual appearance for such a system is very important in order to be able to show and understand at a glance the forces at play in the market. Many options are available, including transparent mode and automatic color changes for white backgrounds.
Pause and Resume
When working with low timeframe bars, at times there isn't enough useful volume in each bar. It's possible to pause a profile and let the volume build where it is at that time. When resuming, you have the option to wait for the next bar to start or to start immediately.
Profile Styles
Delta and Volume Profiles can be separately configured so that they are displayed in a style most suitable to the user and the location on the screen. Both Zone and Bar Profiles have their own settings. Delta is always represented in a way which ensures that relatively large values are highlighted to the user. The relative nature of these values is automatically determined by the software and it's possible to configure how this occurs. In order to be able to visually identify when areas of Delta actually have large values in a more absolute sense, each row of Delta is split into 'Blocks' and the number of contracts represented by each block can be viewed.

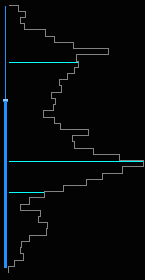
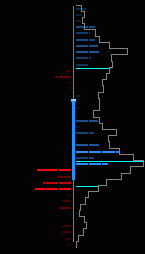
Anchored VWAP
Volume Weighted Average Price can be shown on any Zone - this automatically enables preset options such as Session VWAP, 2Day, 3Day etc. As zones can be manually drawn anywhere, individual areas of a chart can be analyzed with their associated VWAP. Standard Deviations of VWAP can be displayed including SD-1/2/3.
MoveGlyphs
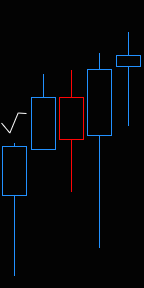
When looking at a normal bar, all we can see is the OHLC, but we have no knowledge of the underlying movement of price during the period of the candle. MoveGlyphs show what actually happened during the bar in a simple way that can be understood at a glance. You will be able to see when contracting or expanding ranges have occurred within a bar - areas of congestion which eventually lead to expansion.
Realtime Step Forward And Back
In addition to the ability to simply draw a manual Zone around any area of interest, it's also possible to watch the way Delta and Volume alter over time by stepping bar by bar through any pre-existing zone in realtime.

Fast Access Menu
Various options are available directly onscreen for every zone created. These menus avoid the need to reload data when changing settings and enable you to continue trading without a pause. The menus and zones can be entirely hidden (using the RADVS button at the bottom left of each chart) or left onscreen to show just the selector or the selector and a caption.
Custom Layout System
Multiple templates can be auto-loaded so that more complex zones can be defined and shown for every instrument
Professional Insights, updated...
This level of information has previously only been available to those who are able to use what's known as a Footprint chart (originally developed by a company called Market Delta and since copied by many others). While an incredible amount of information can be extracted from such a chart by a skilled practitioner, a significant time and learning investment is required in order to read and interpret the many numbers displayed on screen at one time. In addition, the display of such dense numeric data tends to require zooming the chart and changing timeframe in order to aggregate the data sufficiently - this causes moves and structure that are visible at lower timeframes to be lost and requires switching back and forth between multiple charts to get a full read on the price action. We have managed to overcome these issues and give the opportunity to incorporate these insights into trading while still enabling use of the underlying charts and techniques you are used to.
Edge Enhancement
Combined with mainstream analysis techniques, this information allows you to refine Stops, Targets and Entries (Identify Risk First Approach). In some cases, the location you initially identify without this extra information turns out to be a neutral zone as far as delta and volume are concerned - this realization can help keep you out of losing trades where price seems to ignore your anticipated levels or not give the desired reaction. Delta imbalance zones give you something to lean against in your trades - if price wants to move through these zones, it’s usually going to take multiple attempts or a significant increase in buying or selling power.